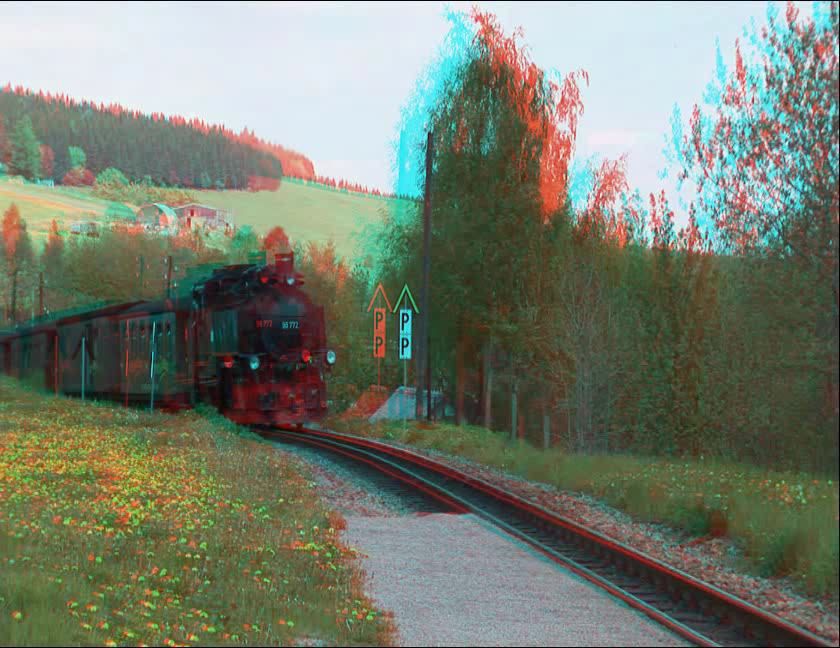
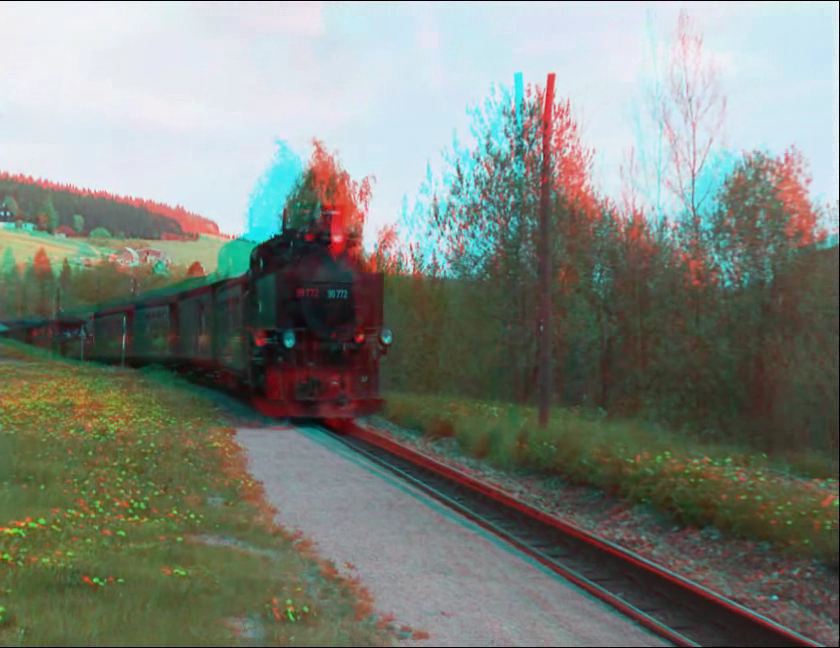
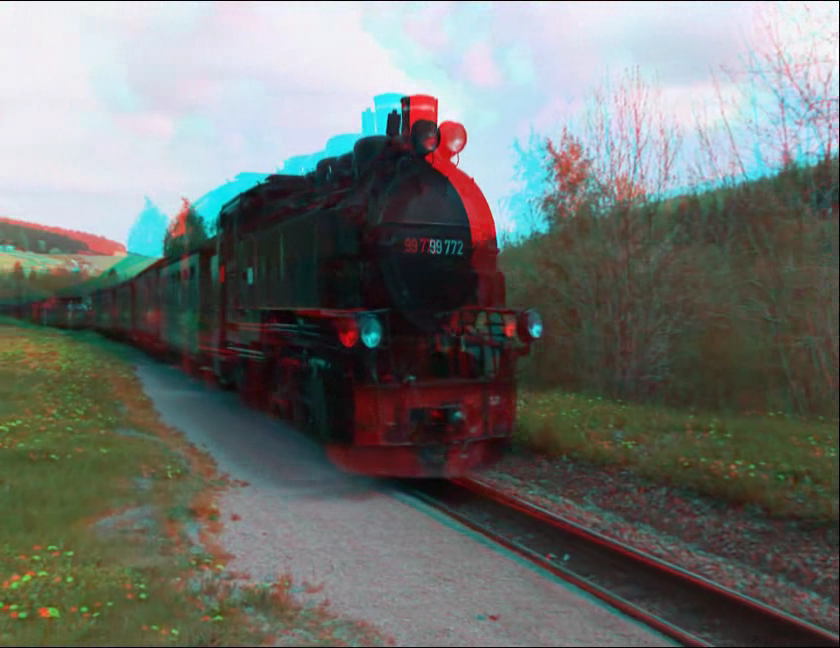
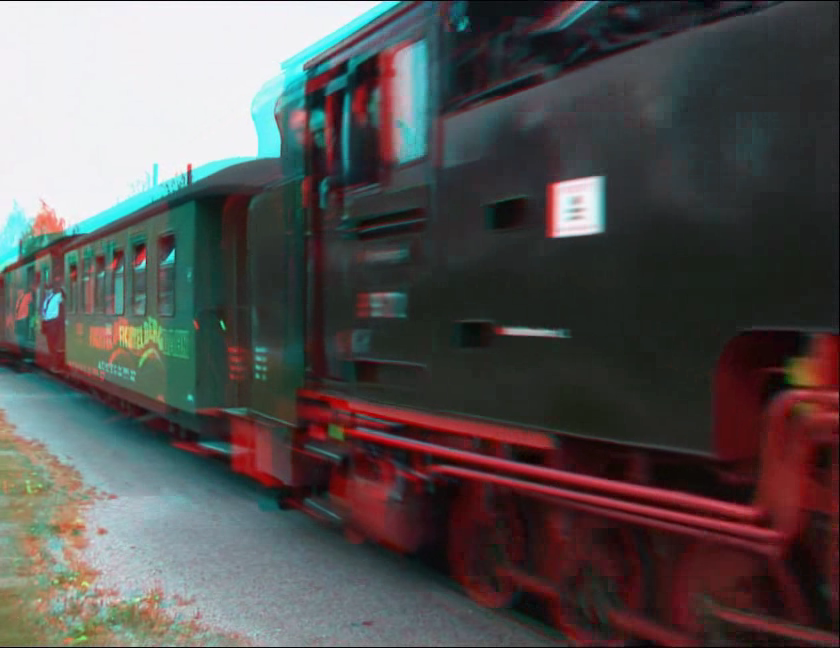
1. Remapping the original depth range to a new depth range using our method.
 |
 |
 |
 |
 |
 |
 |
 |
(a) |
(b) |
(c) |
(d) |
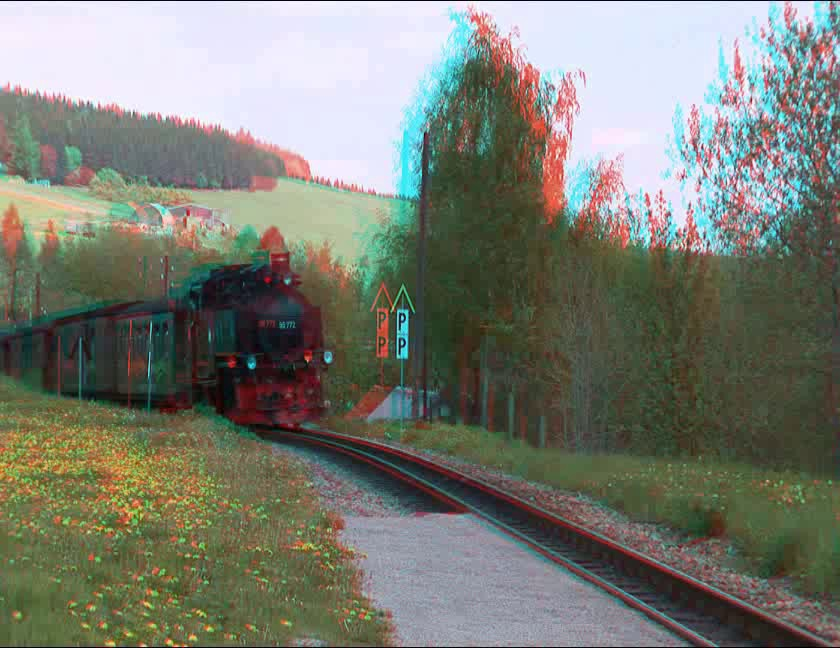
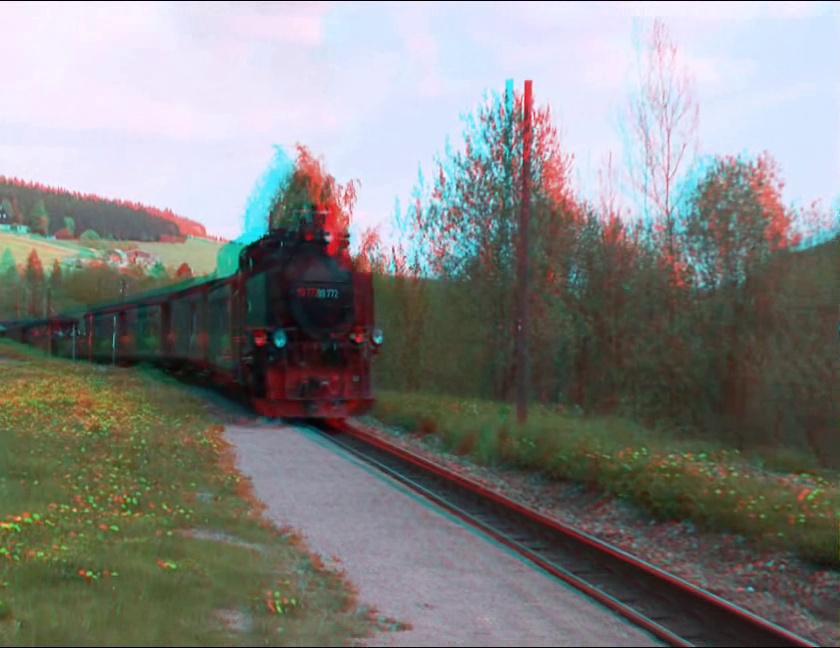
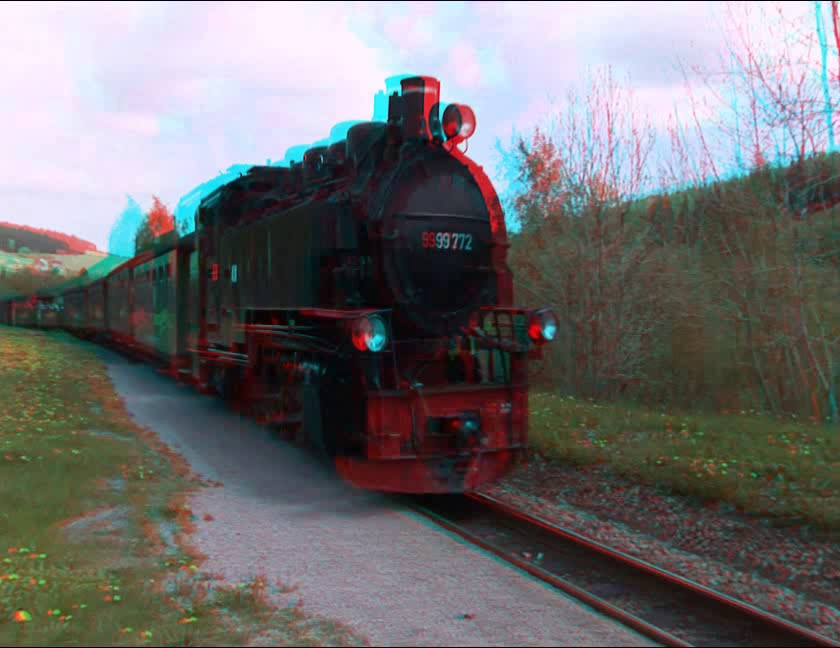
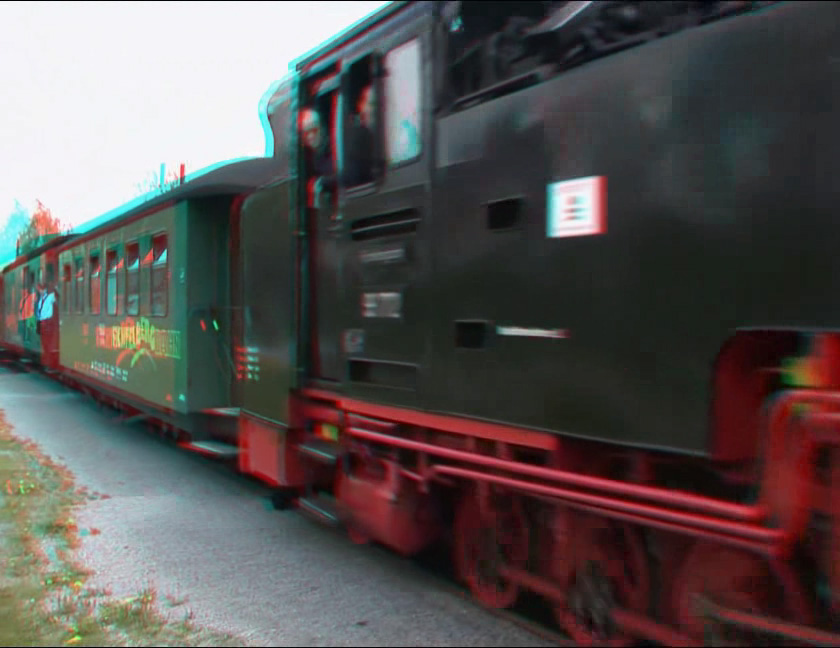
Fig. 1. First row shows the original stereo images from a video clip. Second row shows our results after depth mapping with retinal disparity limits set to η1=0, η2=3. Compared with the original images, we can see that background objects, such as the hill and the trees, now appear further away in the output images. Relative depth distances among the background objects are also increased. We can also see that regular objects, such as the train and the track, are preserved well without any obvious bending, not only between stereo pairs of output frames, but also across video frames (motion coherence). Likewise, depth changes across frames are also consistent (depth coherence). The frame size is 648*840.
 |
 |
 |
 |
(a) |
(b) |
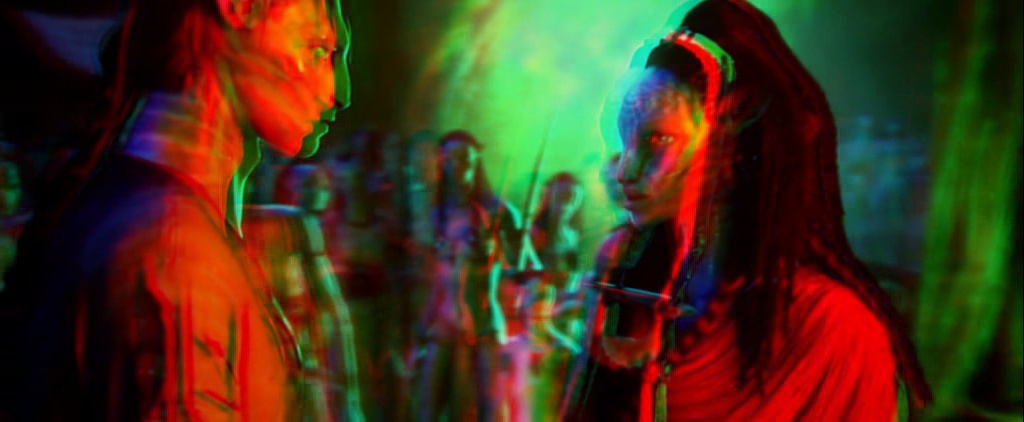
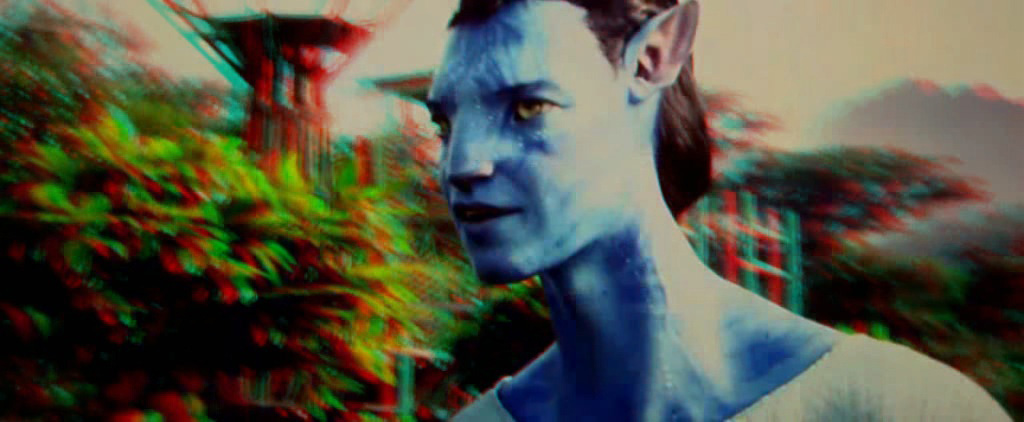
Fig. 2. (a) shows two original stereo images, and (b) shows the output images after depth mapping with retinal disparity limits set to η1=-1, η2=1. As we increase the depth range, we do not observe any cardboard effect in the output images. The frame size is 624*768.
 |
 |
(a) |
(b) |
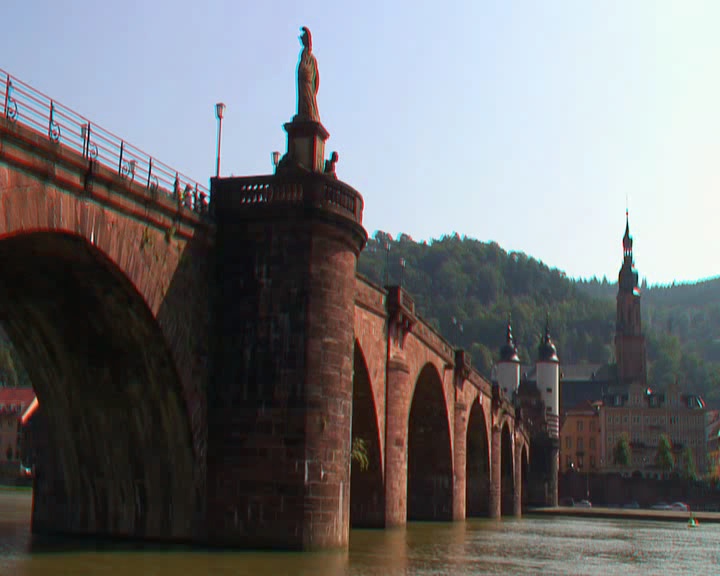
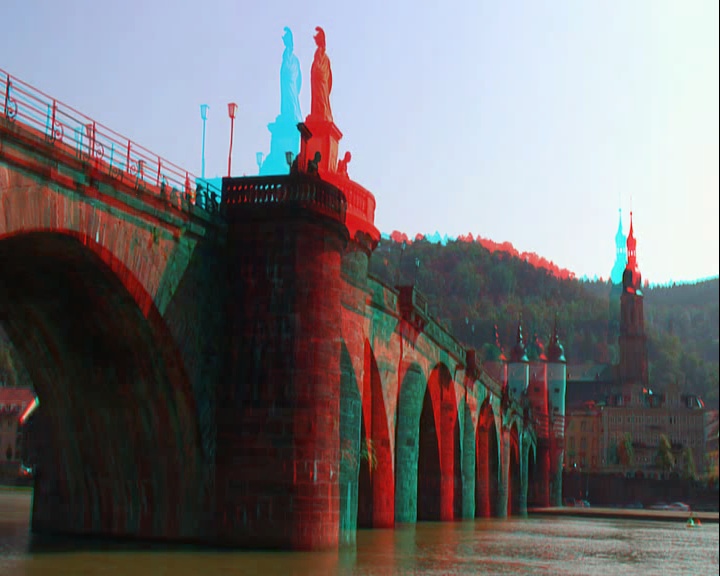
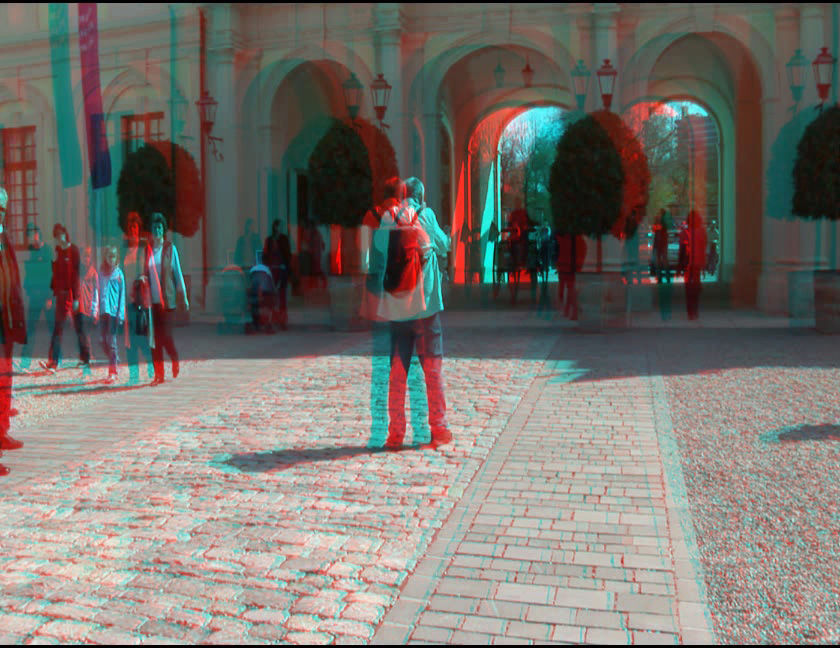
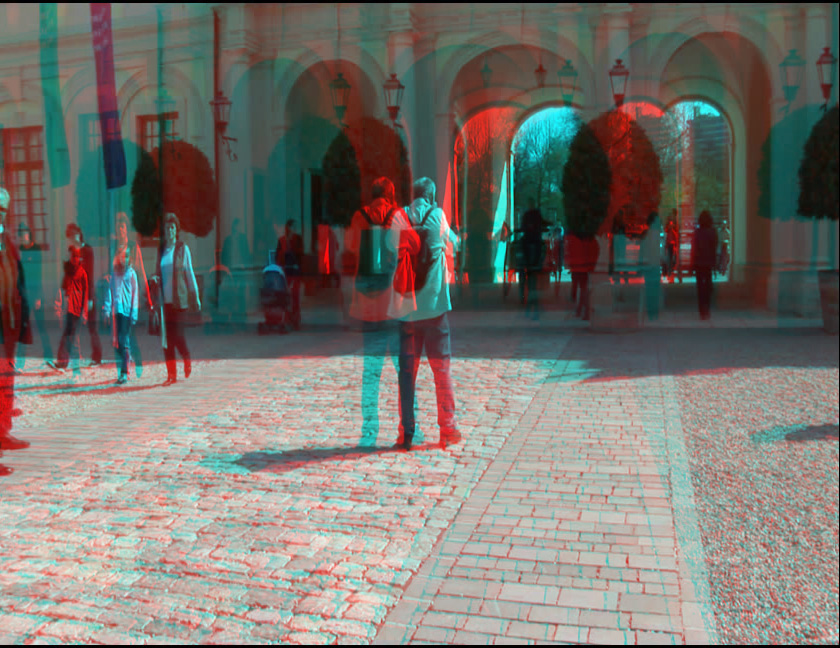
Fig. 3. (a) shows an original stereo image, and (b) shows the output image after depth mapping with retinal disparity limits set to η1=0, η2=3. We can see that if an original stereo image produced for large screen is shown as a small image, its depth range may be reduced significantly. Using our depth mapping method, we can remap its depth range such that the disparity of the stereo image becomes visible as shown in (b). Due to our feature preservation algorithms, we can see that the orientation of the bridge, the fence on the bridge and the buildings on the other side of the bridge appear natural. We do not notice any visible distortions. The frame size is 567*720.
 |
 |
 |
|
(a) |
(b) |
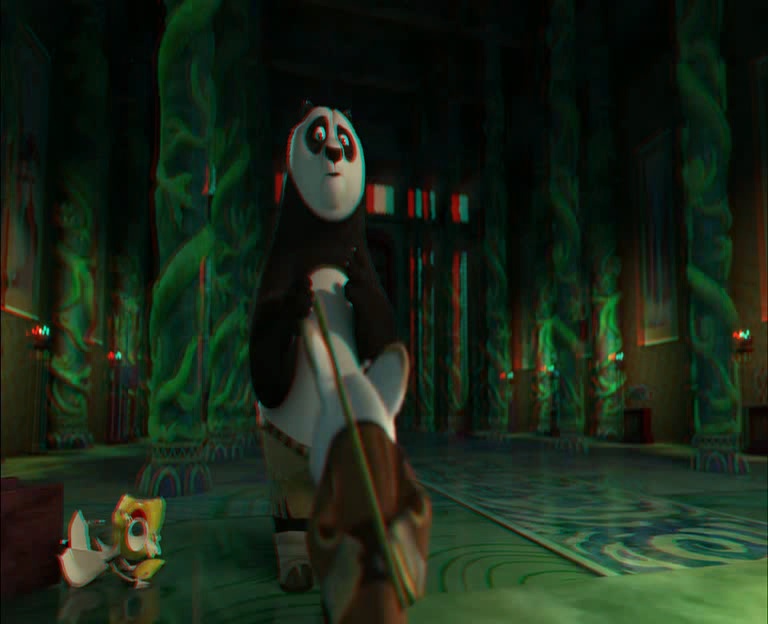
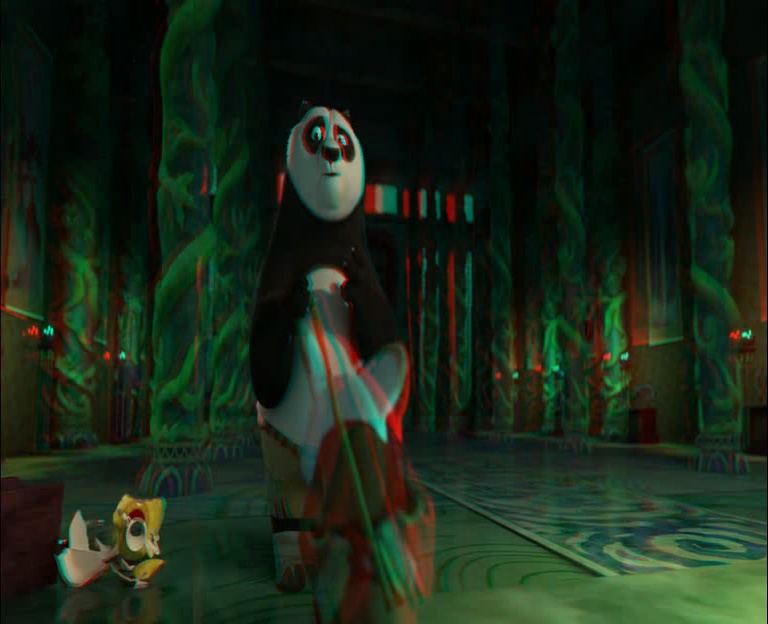
Fig. 4. (a) shows two original stereo images, and (b) shows the output images after depth mapping with retinal disparity limits set to η1=0, η2=2. As we increase the depth range, we do not observe any cardboard effect in the output images. The frame size is 422*1024.
2. Comparing our method with [Lang10].
 |
 |
 |
 |
 |
 |
(a) |
(b) |
(c) |
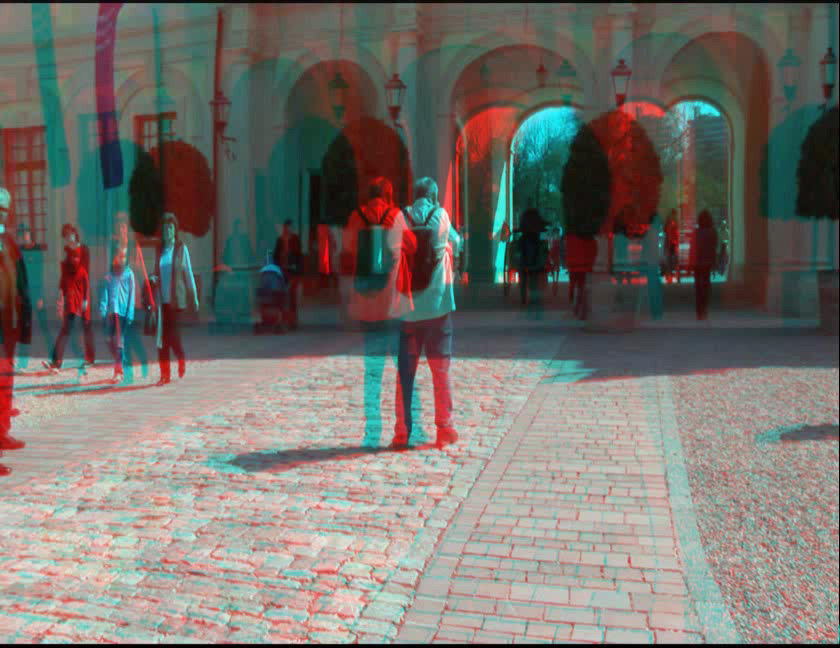
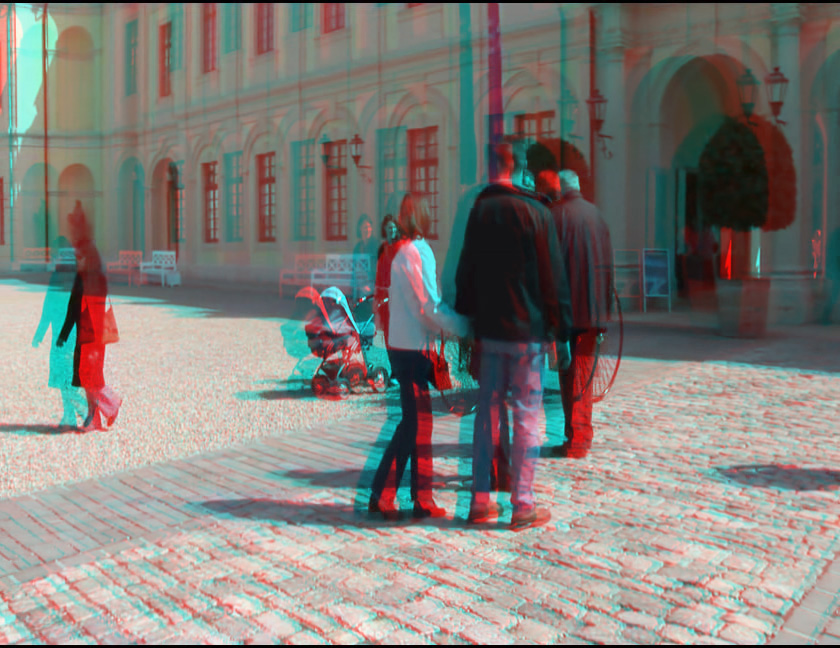
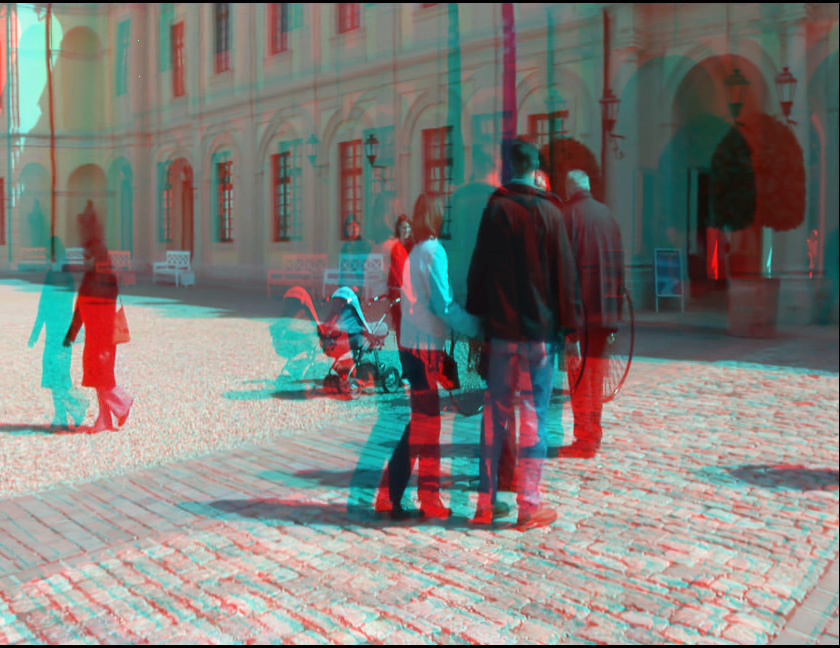
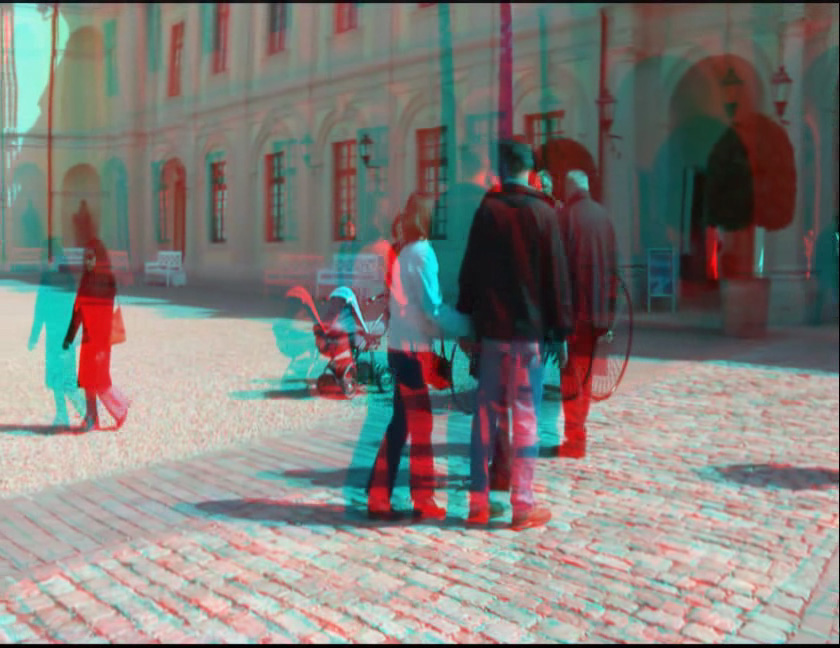
Fig. 5. Comparison between our results and [Lang10]'s results. (a) shows two original stereo images. We double the original depth range shown in (a) to produce (b) using our method and (c) using [Lang10]. From the upper images, we can see that the large stone floor in (c) appears uneven after depth mapping. In addition, the windows on the left hand side of the building are slightly rotated in the left image. Finally, the depth distance between the person in the middle and the building appear similar to (a), although we would expect them to get further apart as we increase the depth range. On the contrary, (b) does not have these problems. From the lower images, we may observe similar problems. We can see that the large stone floor in (c) again appears somewhat uneven. We can also observe different amounts of rotation between the left and right images (an obvious example is the upper second window from the left end of the image). In addition, the black vertical pipe and pillar on the left end of the image are clearly distorted. Again, (b) does not have these problems. The frame size is 640*720.
 |
 |
 |
 |
 |
 |
(a) |
(b) |
(c) |
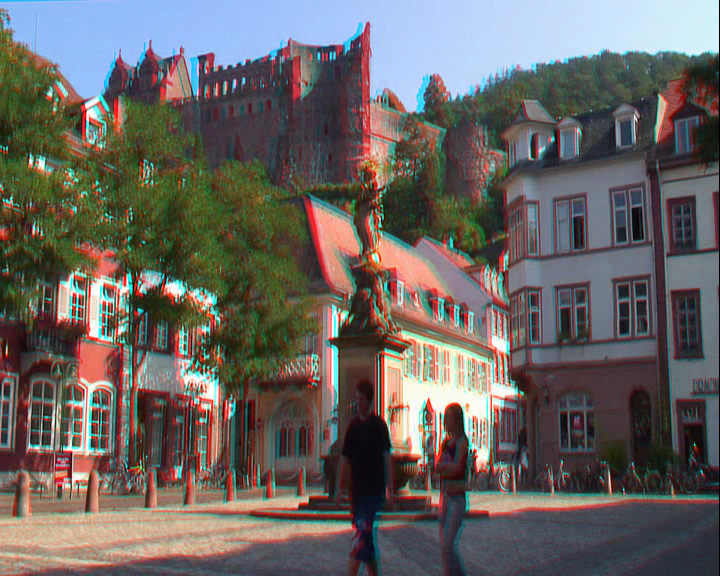
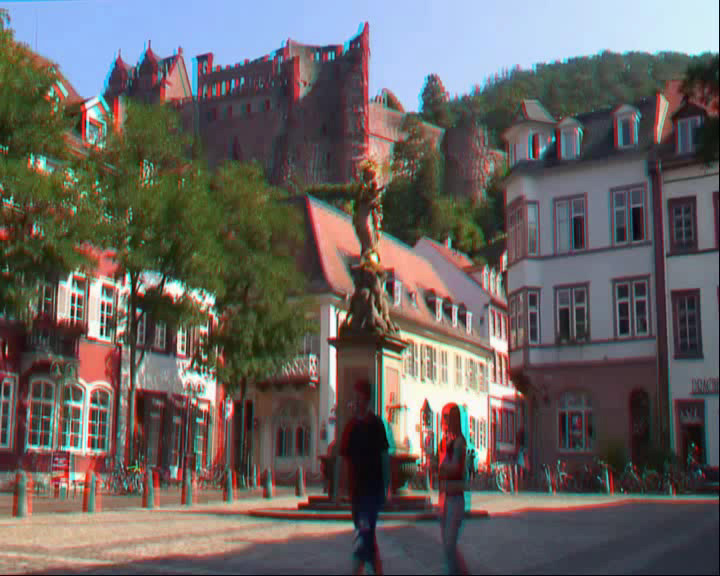
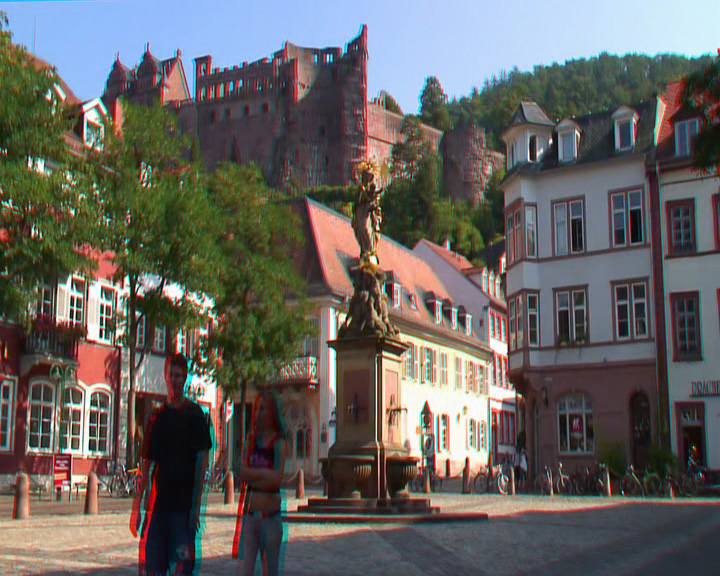
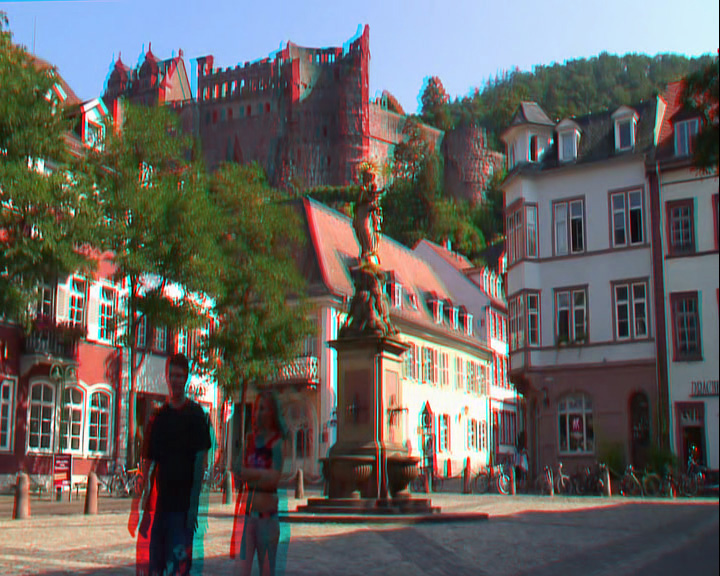
Fig. 6. Comparison between our results and [Lang10]'s results. We double the original depth range shown in (a) to produce (b) using our method and (c) using [Lang10]. Here, an obvious problem is that the relative depth distances among the buildings in (c) are rather similar to those in (a). We may also observe a small rotation in the status located in the middle of (c) (in particular in the lower image). On the other hand, the depth distances among the buildings are much more obvious and natural in (b) and we do not observe any rotation in the status.
[Lang10] M. Lang, A. Hornung, O. Wang, S. Poulakos, A. Smolic, and M. Gross, "Nonlinear disparity mapping for stereoscopic 3D," ACM Trans. on Graphics, 29(3), 2010.